
Automated Facebook Organic Content Analytics & Reporting System
Automatically collects Facebook post data, analyzes performance, and delivers a ready-to-share report in Google Sheets.
Client / Department Overview
Client Type
Digital Marketing Agency,IT Services, Growth Marketing agency
Department
Social Media Strategy & Content Analytics
Tools Involved
Meta business suite, n8n, Google Sheets
The Challenge

The marketing team couldn’t clearly see which Facebook posts were driving results and which weren’t. Because performance data and content planning lived in separate places, insights were fragmented and delayed, making it difficult to optimize content strategy on time.
The team struggled to get a single, consolidated view of Facebook organic content performance. Without all metrics in one place, it was hard to identify top-performing posts, formats, and topics without additional manual analysis.
Key Pain Points
-
1
Heavy Manual Work Every Month
-
2
Lack of Clear Performance Visibility
-
3
Slow, Error-Prone Reporting
-
4
Disconnected Content Strategy Insights
The Automation Solution
We built an end-to-end monthly automation in n8n that works like a dedicated Facebook performance analyst. The system automatically collects Facebook organic post data, analyzes performance, connects results with the content calendar, and generates a clean, ready-to-use Google Sheet report without any manual effort.
Monthly Trigger
Once a month at 6:00 AM, the workflow starts on its own. By the time the team logs in, the complete Facebook organic performance report for the previous month is already prepared.
Facebook Data Fetching
The automation calculates the exact date range for the previous month and pulls all Facebook posts published during that period. This ensures complete and accurate coverage with no missing or extra posts.
Automatic Performance Calculation
For each post, the system fetches key metrics such as reach, views, likes, and interactions. Using these values, it automatically calculates the engagement rate, making it easy to identify high-performing content.
Central Data Processing Table
All post details including post ID, caption, date, metrics and engagement rate are stored in a central processing table inside n8n. This acts as a temporary workspace where data is organized before final reporting.
Content Type Identification
The workflow identifies whether each post is a Reel, Carousel, or Single Image and adds this information to the dataset. This enables clear insights into which content formats perform best.
Content Calendar Matching
The system opens the Social media Calendar Google Sheet, finds the previous month’s plan, and matches Facebook captions with planned captions. Once matched, it pulls the related Topic and attaches it to each post linking real performance with planned strategy.
Automated Report Creation
All enriched data is then written into the FB Organic Content Report Google Sheet. Posts are sorted by date, formatted cleanly, and inserted with all key fields making the report presentation-ready.
Month Header & System Reset
Finally, the automation adds the previous month’s name as a bold header, inserts a blank row for clarity and clears the temporary data table. This resets the system and prepares it for the next monthly run.
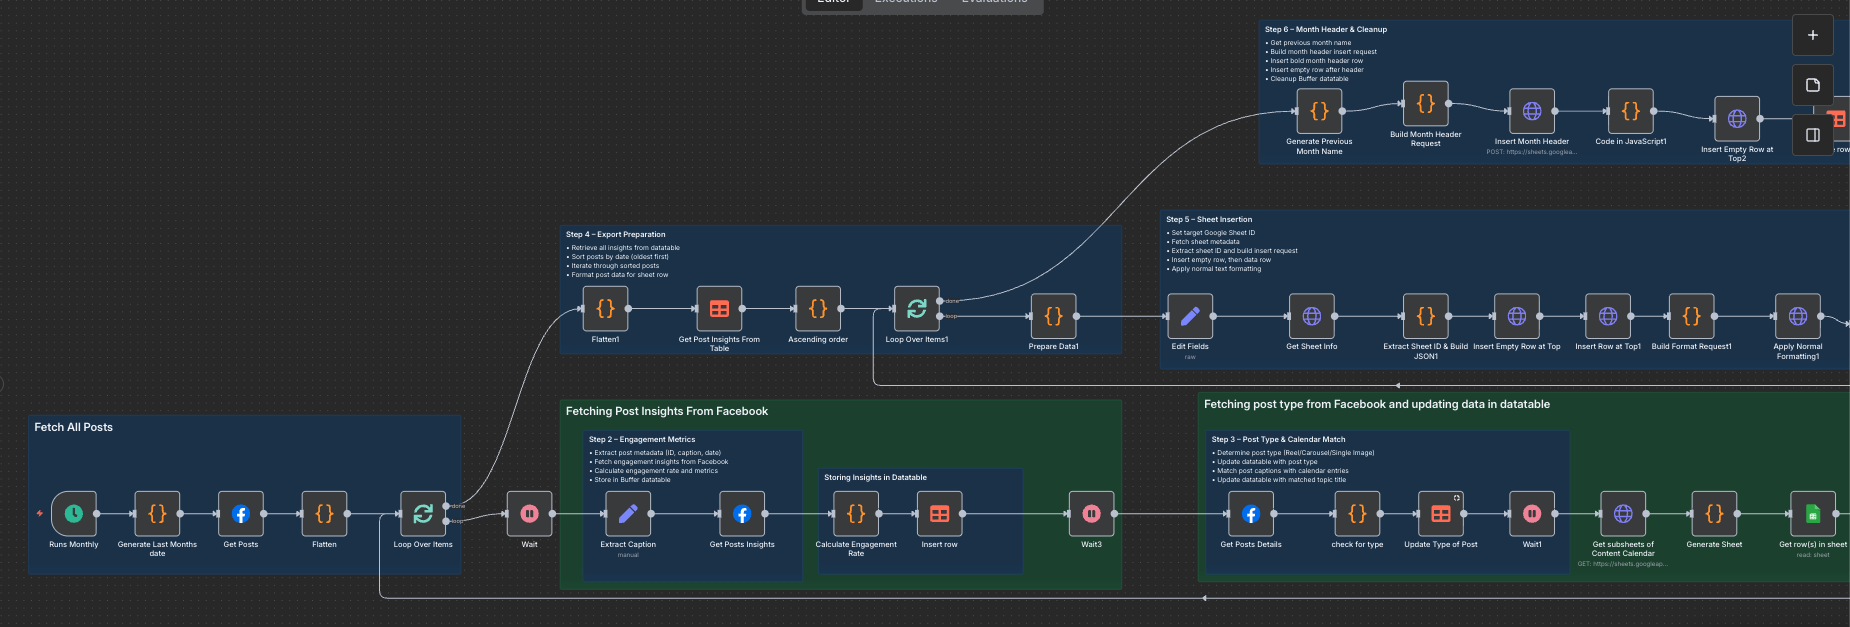
Workflow Diagram
The Impact
Significant Time Savings
The automation eliminated manual data collection and reporting, saving the marketing team 6–8 hours every month. This time is now spent on content planning and optimization instead of repetitive reporting tasks.
Faster, More Reliable Insights
Performance reports are available automatically at the start of each month, with consistent and accurate data. This allows the team to review results immediately and make quicker, data-driven content decisions.
Clear Content Performance Visibility
By linking Facebook posts with content topics and formats, the team gained clear visibility into what content works best. High-performing topics and formats are now easy to identify and replicate.
Error-Free, Scalable Reporting
Manual errors were eliminated, and the reporting process became fully scalable. As content volume grows, the system continues to deliver consistent, structured reports without any additional effort.
Before vs After Snapshot
| Activity | Before Automation | After AI Workflow |
|---|---|---|
| Data Collection | Manual pull of Facebook post data; time-consuming and repetitive | Automatic monthly fetch of all Facebook posts and metrics |
| Report Generation | Manual Google Sheet updates; often delayed by 1–2 days | Ready automatically at the start of every month |
| Error Rate | High due to copy-paste and manual calculations | Near zero, metrics calculated directly by the system |
| Performance Visibility | Scattered data; difficult to identify top posts | Clear, centralized view of all content performance |
| Engagement Calculation | Calculated manually in Sheets | Auto-calculated for every post |
| Content Strategy Mapping | Manual matching with content calendar | Automatically linked to topics and post types |
| Format Analysis | Hard to compare Reels, Carousels, Images | Content type identified automatically |
| Scalability | More posts = more manual work | Scales effortlessly as content volume grows |
Key Features
Fully Automated Monthly Reporting
The system runs automatically every month and generates a complete Facebook organic performance report without any manual effort, ensuring reports are always ready on time.
Engagement & Performance Analytics
It automatically tracks reach, views, likes, interactions, and calculates engagement rate for every post, making it easy to identify high-performing content.
Content Calendar Integration
Each Facebook post is matched with its planned topic and content type from the content calendar, connecting real performance data with content strategy.
Clean, Presentation-Ready Google Sheet Output
All data is organized, formatted, and stored in a structured Google Sheet, providing a clear, shareable report for teams and stakeholders.
Automate Your Facebook Content Reporting
ake control of your Facebook organic performance with a fully automated reporting system.